The Anodot elves have been busy in the workshop, building new features to improve Anodot results and user experience. Over the last few weeks, we have rolled out the following new features:

The machine learning process can be summarized in five major steps as illustrated below:
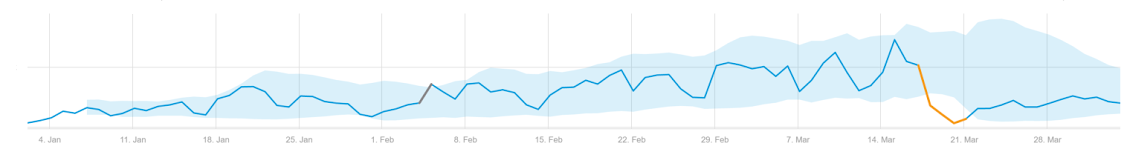
Like most web based businesses and SaaS companies, one of our go-to tools for a quick check of the usage of our service is Google Analytics. Typically we log in and we see the pleasing wave of application traffic, with the predictable seasonal drops during the weekend, and increases during the week. We get a daily report of usage per customer and look at the main flows in our service.
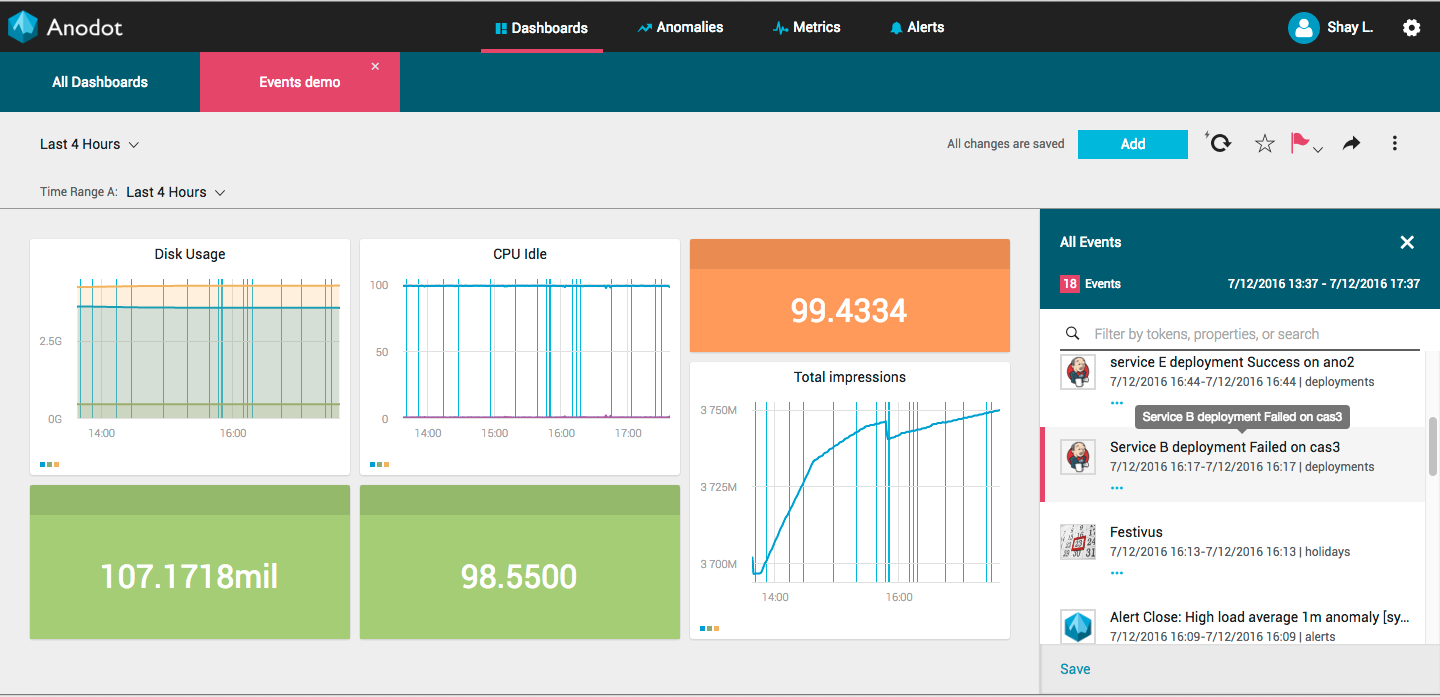
We recently announced a version upgrade to the Anodot service that included a new feature: Anomaly Dashboards, aka Anoboards.