We recently announced a version upgrade to the Anodot service that included a new feature: Anomaly Dashboards, aka Anoboards.
Huh? I thought Anodot Always Had Dashboards
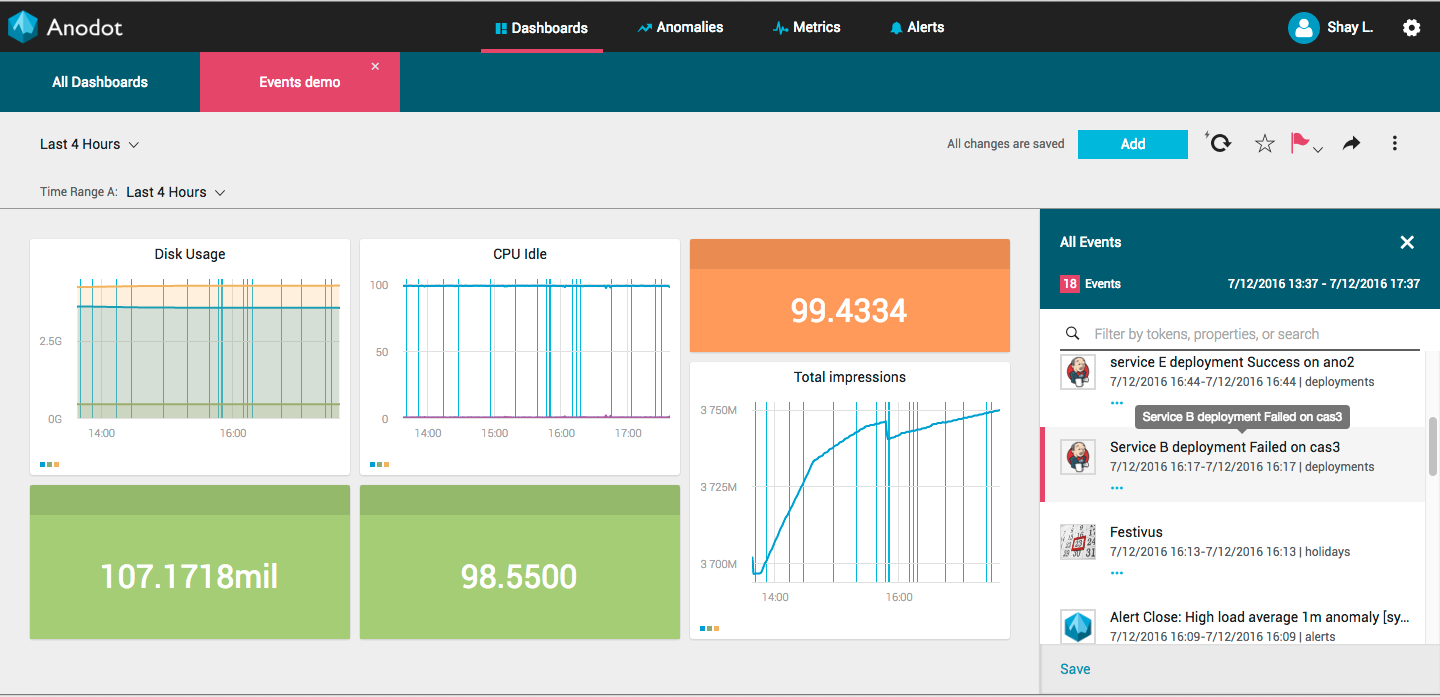
Since the beginning of time (ok, since the solution was launched), Anodot offered dashboards, which is the central repository for accessing and viewing groups of metrics. Dashboards are tiles that you can use to track whatever metrics are most interesting to you. Tiles can be graphs, meters, even free text. For more information about working with dashboards, see the relevant help section.
Anoboards are Dashboards for Anomalies
Anoboards are similar to dashboards in that they are shortcuts to view information that you need quick access to. They let you create customized dashboards that show anomalies for a predefined set of metrics. An Anoboard is a new way for teams and individuals to create customized views of anomalies within a set of metrics that represents the parts of the service that are their responsibility to track. More info about how to set up and use Anoboards in our online help.
Anoboard Uses
Let’s say you are responsible for conversion on an ecommerce site, you might track conversion from each region you are responsible for on a dashboard. However to see where (or even on which server) conversion suddenly spiked or dipped, the anoboard will give you quick access to see exactly where it happened, so that you can investigate it quickly.
Similarly, if you are a factory manager you might want to always view a dashboard of machine temperature for the thousands of machines you monitor. Perhaps you would set up an average of all the machines to display on the dashboard. But if you want to check to see which machine is suddenly heating up more than the others, you could see that most easily on an anoboard.
Different Roles, Different Anoboards
Most of our customers have lots of people using Anodot, each for his or her own incident detection needs. For the executive user, tracking revenues is most important, for the operations user product inventory or factory output, and for the technical user CPU and server errors.
All of these and other roles can benefit from Anodot, and using anoboards and dashboards, each user or user group can create their own shortcuts to see exactly what interests them, to get the most out of the system.
Haven’t tried Anodot yet? You can try it for free for 30 days.