The machine learning process can be summarized in five major steps as illustrated below:
- Define the business problem
- Collect and prepare data
- Train and test model
- Deploy model
- Monitor model’s performance
 The diagram to the right - which I borrowed from this great blog post about machine learning, illustrates how the steps feed into each other into a cycle.
Most available data science tools put a lot of effort into helping and automating steps 1-4, but how does one monitor intelligently the performance of models, especially if there are many of them, involving multiple types of algorithms that feed into each other? What if your model is trained and deployed on multiple data streams in parallel (e.g., data from multiple customers, products, etc)?
While it is best practice to define a clear performance measure for each model, if multiple models are deployed, it is unfeasible to manually monitor and track them.
For example, at Anodot, we designed an anomaly detection system which is applied to a very large number of time series signals. All in all, our system runs approximately 30 different types of learning algorithms, each one with its own parameters and tuning capabilities. These algorithms run constantly on all the signals that are sent to us by our customers (currently more than 40,000,000 reporting every 1 to 5 minutes), generating at least 1 model per unique signal.
How can we track the performance of these algorithms, to ensure they are continue to perform well? What if they work well on some data streams and not as well on others? The answer is simple - we use machine learning algorithms to track and monitor the performance of our machine learning algorithms.
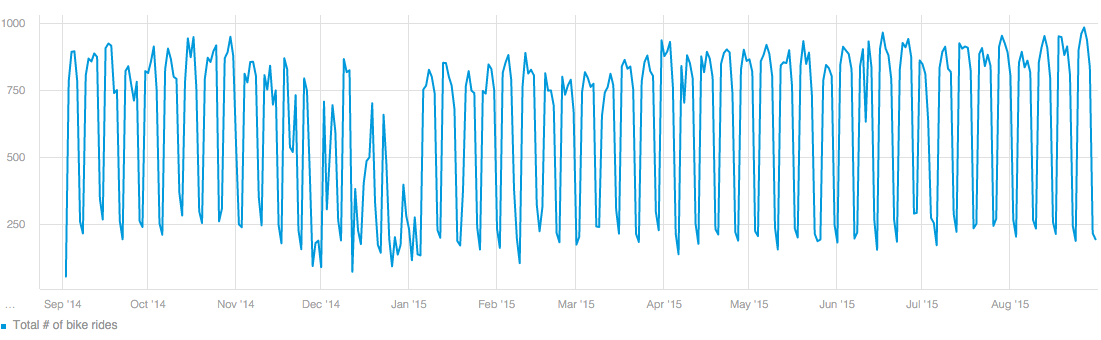
The first step is to constantly measure various performance indicators for each of the algorithms. We measure the number of anomalies we discover for each customer, their rank score distribution (this is based on another one of our algorithms which ranks anomalies in terms of their priorities), the number of seasonal patterns discovered, number of clusters and their quality from our various clustering algorithms, and many more. These performance measures are reported over time and can be plotted over time just like any other time series signal.
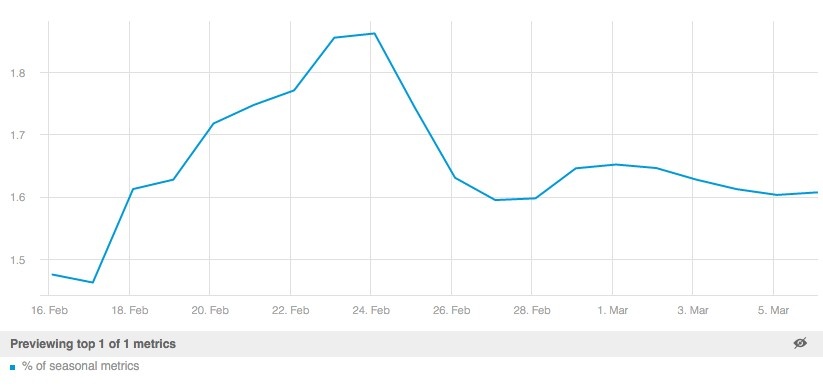 Example of time series performance measure of seasonality detection algorithm: % of seasonal metrics shown over time
Now that the performance of the models is continuously being measured, the second step is to use algorithms that learn their normal behavior, and alert whenever they behave anomalously. Luckily for us, we did build an anomaly detection system - we just let it learn the behavior of our own algorithms through the performance metrics we collect, and alert us when they start showing abnormal patterns.
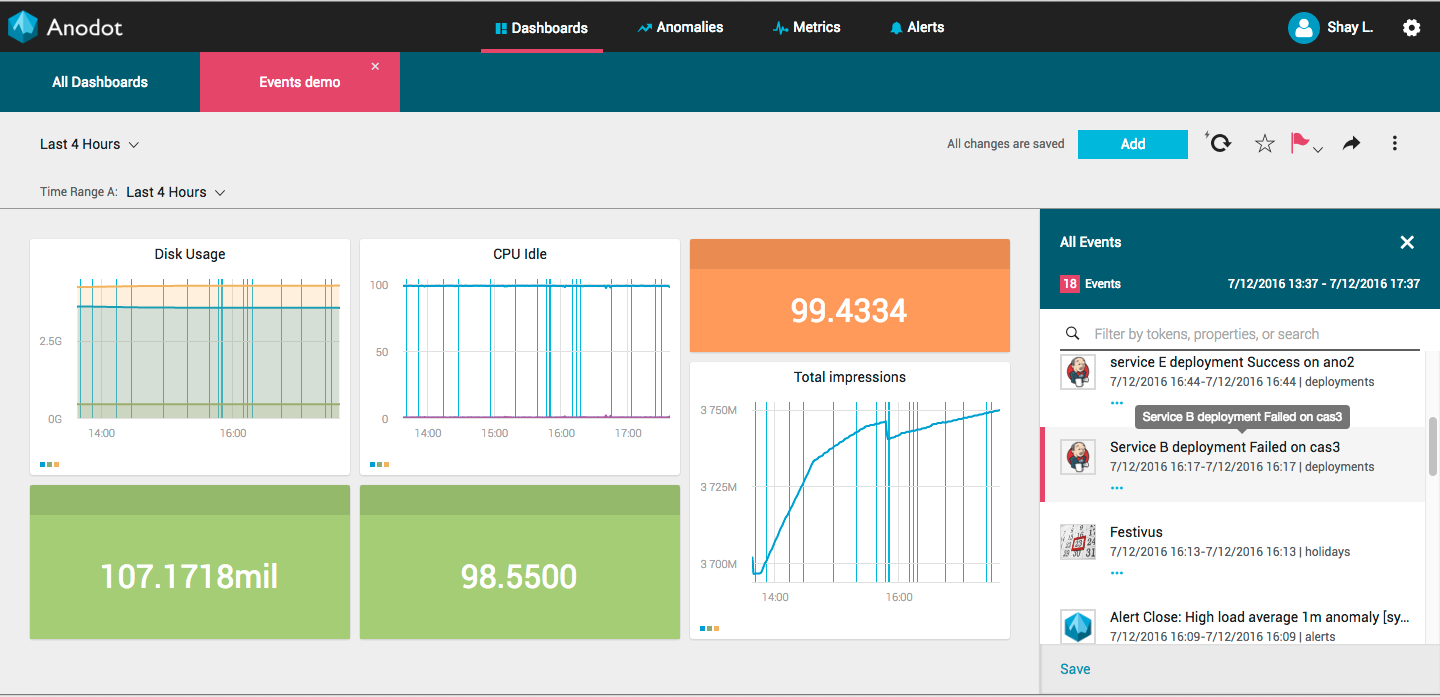
For example, when we get an abnormal change in the number of anomalies our system discovers, we can quickly determine if it was due to some algorithm tuning, a bug, or a valid shift related to a particular customer - the example below shows such a case, where an issue with one of our models caused a spike in the number of anomalies detected by the system.
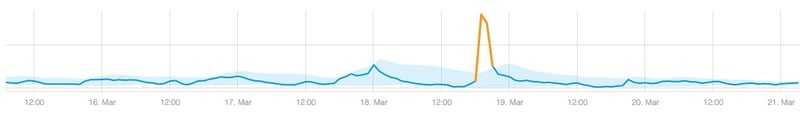 Spike in number of anomalies detected by the system caused by avmodel issue
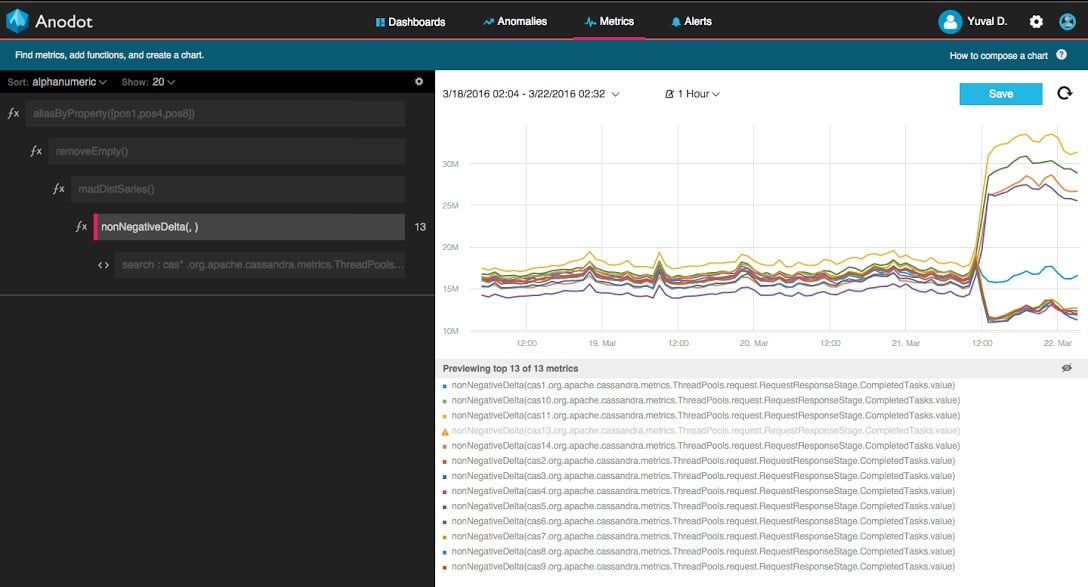
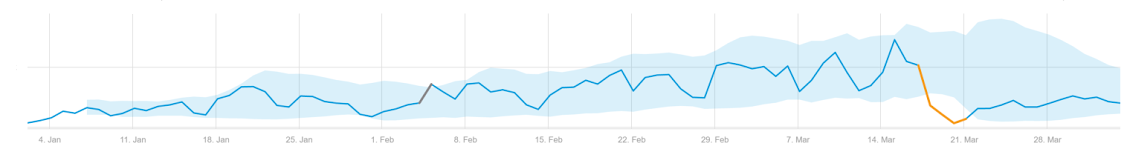
In another example, an anomalous change in the scoring algorithms was caused by a change in model parameters which we deployed into production. We received an alert immediately and our data science team was able to fix it quickly.
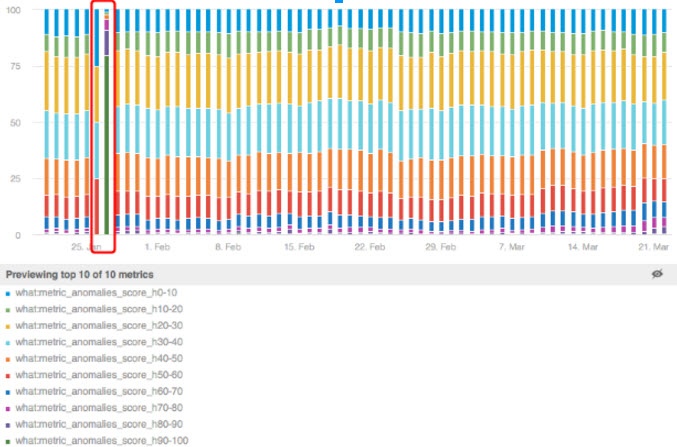 Distribution of anomaly score over time. Anomaly in distribution caused by misconfiguration error.
Additionally, because we measure these performance measures at various granularities (e.g., per customer), the alerts help our data science team discover issues that may be specific to a segment of the data streams we get, allowing for quick improvements and enhancements of the specific algorithms. For example, behavior of certain metrics for our web business/ e-commerce customers will differ from the behavior of metrics for IoT and other types of customers.
To summarize, monitoring machine learning models through the use of machine learning models is the most efficient and scalable way to close the “machine learning process” loop. It requires two simple steps:
- Continuously measure the models’ performance
- Use algorithms to learn their behavior so abnormal changes in them can be detected and acted upon by the data science team.
I will be speaking about this process more in depth at the upcoming Berlin Buzzwords conference, June 5-7, and look forward to everyone’s questions.