We recently took a closer look at data made publicly available by the Bay Area Bike Share to see if we could find some anomalies by streaming the available data into Anodot's business incident detection system. The company, based in the San Francisco, set up bike rental stations throughout the Bay Area. Users can sign up for a 24-hour, 3-day or annual membership, which grants access to the bikes.
When examining the numbers, we found seasonality consistent with what was demonstrated in the 2014 Data Challenge. For example, in the graph below - Total Number of Rides - there are many more rides on weekdays and fewer on weekends and holidays. The constant numbers probably indicate that the bikes are being used by people that need to get from point A to point B on a regular basis...in other words, commuters.

In the graph below - Ride Duration - weekday rides average 10 minutes, while weekend rides are nearly twice as long. This also is indicative of weekday work/weekend pleasure usage.

We then looked at the number of rides for annual subscribers (green) versus other customers, also called non-subscribers (blue). The graph below shows that non-subscriber rides peak on the weekends. There are fewer non-subscriber rides on weekdays, and the opposite is true for subscribers. This makes sense if the subscribers are using the bikes to get to work, since they (hopefully!) aren't working on weekends. Non-subscribers could even be tourists.

Additionally, the length of rides (in minutes) for subscribers (green) versus non-subscribers (blue) varied greatly. We see below just how drastically the length of rides varied. Subscribers ride for an average of seven minutes, while non-subscribers ride from 20-40 minutes. We also see that ride duration is much longer on the weekend.

When we looked at the number and duration of rides together, the following graph shows the duration peaks are anticorrelated with the number of rides (and happen on the weekend).

So, with the data as our basis, we can jump to some interesting conclusions: that Bay Area Bike Rider subscribers are residents who most likely use the bike share for commuting to and from work while non-subscribers (i.e. other customers) are tourists or visitors who don't ride much during the week but use the program for longer sightseeing and recreational rides on the weekends. From the shape of this data, it seems that Bay Area Bike Share is providing a crucial service that replaces other forms of commuting, such as car or bicycle ownership, or another form of public transportation.
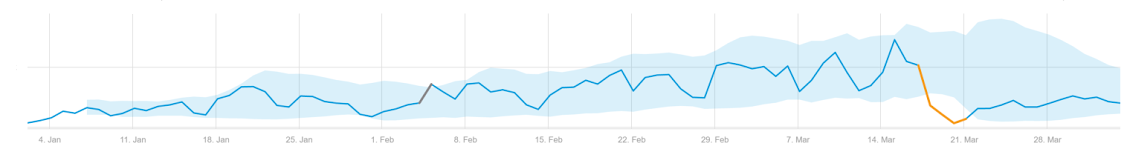
And as for the anomalies...of course there were major drops in number of riders during Thanksgiving and Christmas/New Years. More interestingly, you can see the anomaly below that we found an anomaly (a decrease) in ride duration that originated from the 2nd at South Park station. It happens immediately after a long period of duration increase. You can see in the graph that the length of time each person kept the bike increased over time, and then suddenly decreased.

To understand this a bit more deeply, we compared rides that started at this station with rides that ended at it, and it's clear that the growth trend happened only with rides that started there, not those that ended there.

Our initial guess was that there was some construction in the area that may have lengthened the riding time, but we researched it a bit and did not find anything relevant. The increasing duration was consistent to the two main stations that riders rode to from this station, in two completely different directions. Another possibility is that there was an increasing problem with subscribers unlocking the bikes that was then fixed. Units in the graphs above are seconds, so you can see that the major drop (which was maintained afterwards) was around three minutes.
We also noticed a major anomaly in mid-December, when the duration spiked.

We checked with Bay Area Bike Share and one of their employees, Ashley Turk, explained that this could have been due to outlier trips of greater than two hours during that time period.